Report Library
Amy Midkiff (Unlicensed)
Ross Carver
Overview
Reporting is a necessary evil. There is a seemingly endless list of preferences and ways to present reporting, yet it never seems like much fun to run reports. We understand the frustration - we developed the Reporting Library to help simplify and automate the process, and this article we will give you the know-how to making running reports as painless as possible.
Avantalytics provides our clients with over 100 pre-made reports that are at the ready for you with more being added each month. You save time by not having to design and architect the data relationships - but you will have to become familiar with which reports provide which data.
Report Library Basics
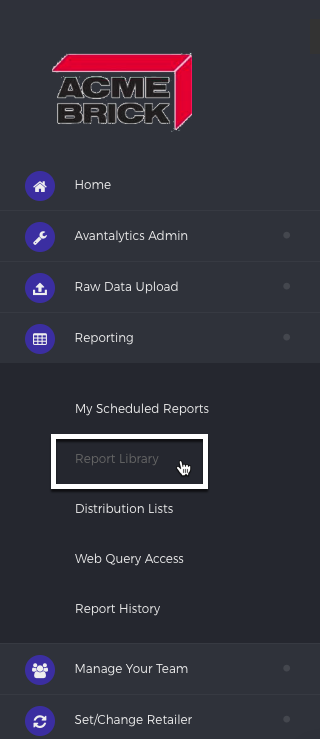
To get to the report library, click on the "Reporting" option on the upper menu on the left side of your screen:

When it opens, click "Report Library":

When you click on the Reporting Library, you will see all of the pre-made reports Avantalytics designed for your use in a searchable list, divided by categories:

Hovering over any of these reports will bring up a pop up description of the given report.

Typical report export formats include HTML/Web Reports, CSV (Comma Separated Values), and Excel. Depending on the report, you will have at least one of these options available.
If an option is not available, its most likely because the richness of the formatting of the report does not lend well to exporting to the given format. For example, reports with graphs and other interactivity will not be exportable to Excel.
Clicking on any of the report titles brings up the variable options for you to choose from. Doing so should produce results similar to the image below:

While the choice could seem overwhelming, most reports have just a few parameters that you are required to set; all of the others parameters are optional and can be used to limit the results. For example, in nearly ever report, you will need to select one or more time periods. Time is a primary dimension of many things - sales performance, inventory performance, store visits, etc. For this reason, we provide you many pre-set options that match the retailer's specific dates - periods like Fiscal YTD, Week, Calendar YTD, 52 Weeks, and more.
For many reports, choosing a time period is all the report requires you to do. If you chose nothing else, the report will pull data for all other parameter types such as all stores and all SKUs. Ultimately, this produces a large report and, in most cases, is more info than what you are looking for.
Once you've chosen all your report filters, the last step is to choose "Generate Report," located on the bottom right of the report parameter page. A tab will open in a new window, and you will receive your report as a web URL by default.

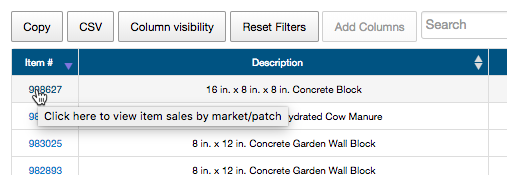
Web reports are great because they offer drill through capabilities. For example - in the screenshot above, notice that the far left column has item #s that are blue instead of black. This indicates that it's an interactive hyperlink. If you move your mouse over one of the item numbers, the Avantalytics reporting system will tell you what clicking on the hyperlink will do:

Another reason web reports are handy is because you can tweak the parameters of the report after you've run it by accessing the blue area in the upper left hand corner of the report that lists the parameters:

Simply moving your mouse to the parameter you want and double clicking will bring up a menu that allows you to tweak that parameter and re-run the report. That's it for the basics of navigating the Reporting Library itself.